Friday, May 27, 2016

Finding NWEA's Mean CGI and its Percentile for your Class

I have been asked by teachers how to find the average Conditional Growth Index for their class.  Although NWEA includes the median CGI for a particular class, many teachers are interested in mean instead of median.  Below are the steps for calculating this.  It might be useful for a teacher who is interested in comparing how her overall growth in between testing events compared with others like her:


  1. Login to MAP.  Under “View Reports” click “MAP reports”
  2. Under “Achievement Status and Growth” click on “Projection or Summary”
  3. Select the term rostered and term tested as appropriate.  To run a fall to spring comparison (as my district does), choose the spring term for both
  4. Select the class (or classes) for which you want to run the report
  5. Select the appropriate “Growth Comparison Period”.  Again, my district is interested in fall to spring, so that is the one I select.
  6. Under “Norms Reference Data” leave “2015 Norms Data” selected.  CGI is not included in reports run with 2011 Norms.
  7. At the bottom of the screen, click the blue button “Create Spreadsheet” and then download and open the spreadsheet
  8. If you have two or more separate test areas per class like my district does, you will have to separate the spreadsheet into multiple tabs to disaggregate the tests.  For instance, I only want to run the CGI on my class’s math scores, so I remove the reading scores from the spreadsheet.
  9. Once I have separated the subjects, I apply the following formula:
    1. Find the column labeled, “ConditionalGrowthIndex” - in my spreadsheet it was in column AL.  This column contains the individual student CGI scores
    2. In the empty cell below the values in this column, place the following formula, “=AVERAGE(AL*:AL*) - in my spreadsheet the values were in cells AL2 through AL16 so it looked like this: “=AVERAGE(AL2:AL16)”
    3. Once averaged, I found out that the mean CGI for the math scores in my class was 0.96, or .96 Standard Deviations away from the mean growth of similar kids.  Mean growth is represented as 0.
  10. If I want to find out what percentile 0.96 is so that I can see how my overall growth compares to others, then I have to apply another formula to that figure.  The formula (which I place in the cell below the AVERAGE) for calculating the percentile is as follows: “=NORM.DIST(AL17,0,1,TRUE).  The values for this formula are explained below:
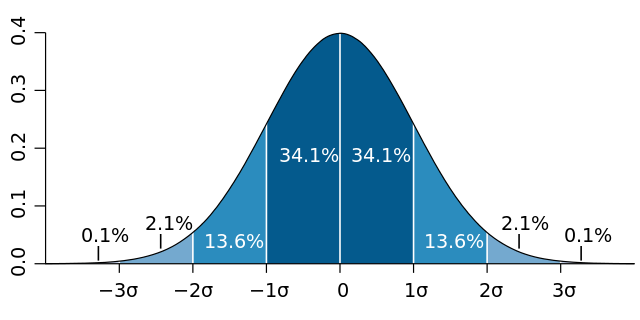
    1. NORM.DIST allows you to find where the value for X (in our case 0.96) fits on the bell-shaped curve
    2. X in my case applied cell A17, adjust your location for X as needed, but remember it should be the mean of your class CGI
    3. According to NWEA, the mean for their CGI formula is 0, so use 0 as the second value in your NORM.DIST formula
    4. The Standard Deviation NWEA uses for calculating CGI is 1, so use 1 for that value in the NORM.DIST formula
    5. You want your CGI results to be cumulative, so use “TRUE” as the final value in the NORM.DIST formula
  11. Applied correctly, this tells me that my class average of 0.96 CGI is in the 83%ile for overall growth compared to other teachers like me.


I know this is a lot of steps, but hopefully it provides a useful metric for looking at both individual student growth in your classroom and how your overall growth might compare to others like you.

Friday, May 6, 2016

Great Educators are Thorough

A few weeks ago I had to have a root canal done on my number 14 molar.  Apparently I have a pretty high pain tolerance, because when I went to the dentist complaining of some discomfort related to hot or cold beverages, he opened up the tooth exposing the root and exclaimed, “Wow!  This is pretty bad!”  That is something you never really want to hear your dentist say, by the way.  After letting the fluid drain for a bit, he prepped the tooth for the job.  For those of you who have never had a root canal, it involves exposing the nerve chambers within the tooth and then using a metal file (like the one shown below) to scrape out the infected/damaged nerve.  


One of the keys to a successful root canal is to ensure that all of the nerve has been removed, thereby eliminating the chance of future pain for the patient.  In order to ensure all of the nerve has been removed, the dentist will often take X-Rays of the tooth with the file in the nerve chamber so that he or she can see the contrast between the file and the tooth, allowing him or her to see the depth to which the nerve has been scraped and if any nerve material has been left behind.  Once the entirety of the nerve material has been successfully removed, the dentist fills the nerve canals of the tooth with an epoxy-like material and seals off the top of the tooth with a filling or crowns the tooth, protecting the worked-on area.

Due to some difficulties both with my tooth and with my dentist’s X-Ray machine, the procedure described above took a touch over two hours.  During that time, my two oldest sons were in the waiting room and I was praying they were not destroying it.  At the same time, I was grateful for his thoroughness.  For example, at one point he was having a difficult time getting an accurate picture of the depth of the file in my tooth.  He took several X-Rays, over and over telling the hygienist, “I want to see this more clearly.  If we have left anything behind, Pete is going to be in some pain and I don’t want that.”  At no point did he say, “Whatever.  I can’t get a good picture.  I’m sure it is good enough.

Those dreaded words.  Good enough.  How often do we say those words regarding the education of the students entrusted to us?  What exactly is good enough anyway?  With my root canal, good enough was making sure no nerve material was mistakenly left behind.  With our students, is good enough making sure they pass?  Getting all of their homework turned in?  Completing the missing project?  Getting through our class?  Walking with their peers at promotion/graduation?  Growing by a certain metric on a standardized test?  

What if it was your tooth?  What if it was your child?  How would you define good enough then?  Do you have a measure by which you define success with each individual child?  If so, what is it and how do you know you have hit it?  If not, why not?  If it were your child, how would you want his or her teacher to answer that question?  Since every one of the students entrusted to us is someone’s child (and therefore perhaps their whole world), shouldn’t we all have an answer to that question?  And shouldn’t we be prepared to show evidence of what that measure is and where each child is according to that measure?  I am certainly glad my dentist knew what to look for.  My tooth is now pain free.  Great educators know what to look for with their students, too.